The Biggest Price Drivers
Six forces move commodity prices. Understanding each one — and how they interact — is the difference between reacting to markets and anticipating them.
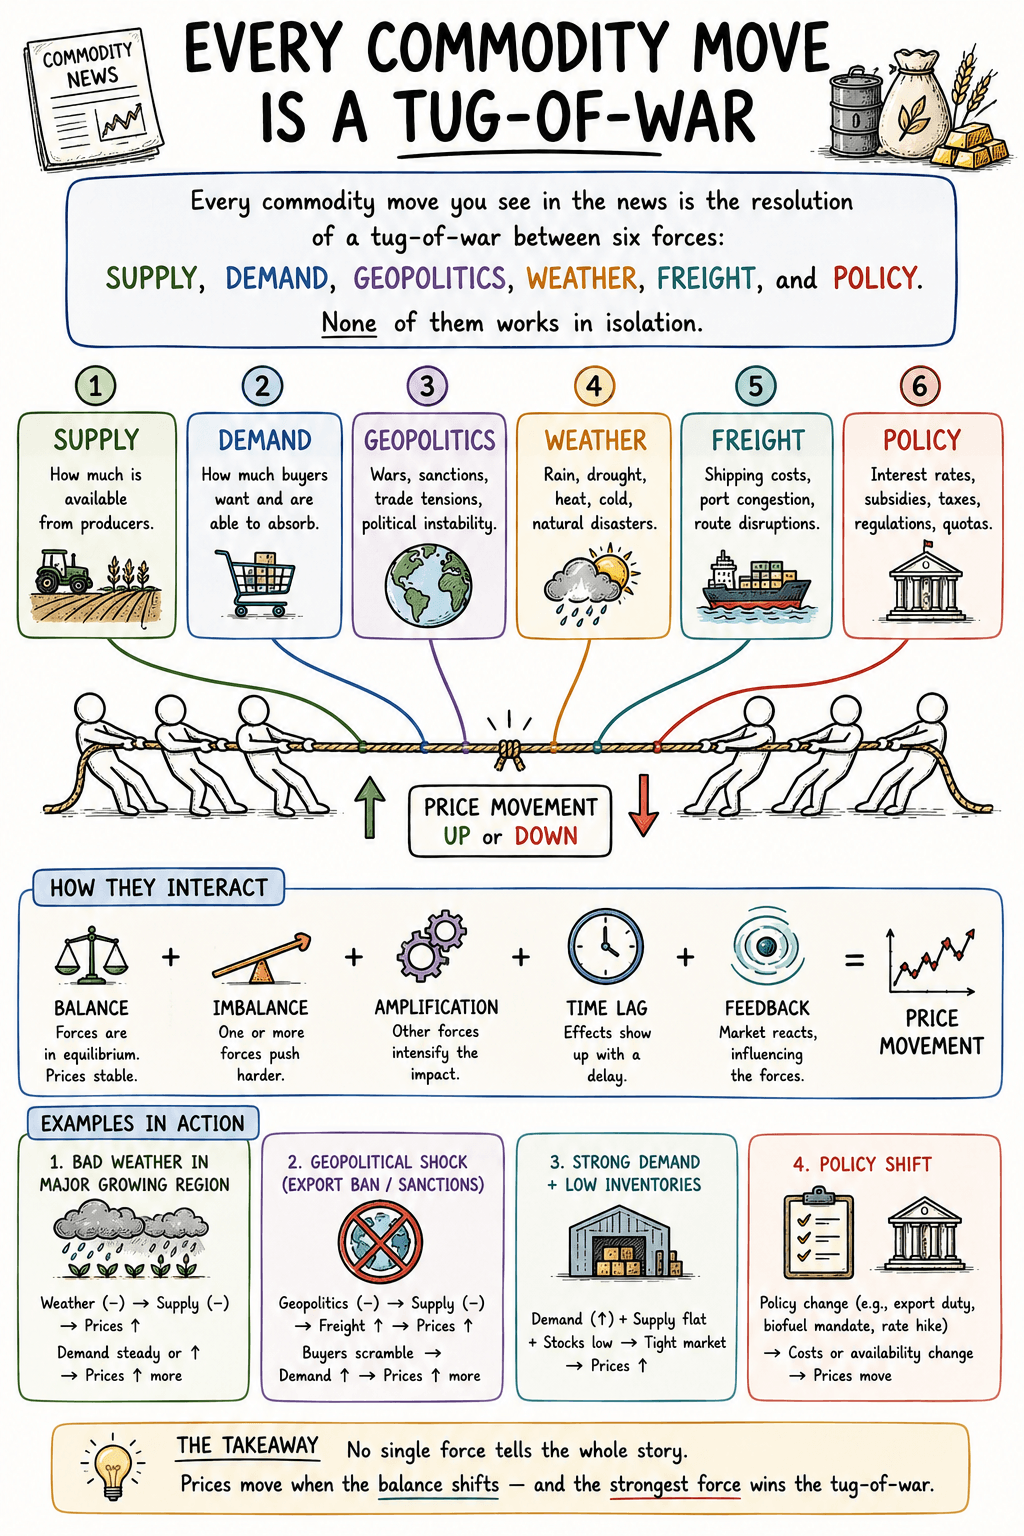
Commodity prices look chaotic from the outside. From the inside, they follow six clear forces — and great operators learn to read all six at once.
Why Prices Are Never About One Thing
Every commodity move you see in the news is the resolution of a tug-of-war between six forces: supply, demand, geopolitics, weather, freight, and policy. None of them works in isolation. A cocoa rally in 2024 wasn't just bad weather in Côte d'Ivoire — it was bad weather plus an ageing tree stock plus a swollen-shoot virus plus stronger sugar demand plus exporter cash-flow stress. A copper rally is rarely just AI data centres — it's data centres plus mine disruptions plus the spectre of US tariffs plus financial flows.
The discipline of commodity intelligence is learning to hold all six drivers in your head at the same time. When you can do that, the market stops feeling random.
Driver 1: Supply
Supply is the most fundamental driver because it is the most physical. The world either has enough of a commodity or it doesn't, and the gap between those two states is usually narrow.
What moves supply:
- Production decisions — OPEC+ quotas, mine output, planting acreage, plantation yields.
- Disruption events — strikes (Chilean copper mines), accidents (smelter fires, refinery explosions), disease (cocoa swollen shoot, citrus greening, avian flu).
- Capacity additions and shutdowns — new LNG terminals, mothballed aluminium smelters, refinery closures.
- Inventory levels — exchange warehouses (LME, COMEX, SHFE) and government strategic reserves (US SPR, China's strategic reserves of grain and metals).
- The investment cycle — too little capex in 2024–25 creates a supply squeeze in 2027–28, classic commodity cycle logic.
Latest reality check: Mine supply across the copper complex was heavily disrupted through 2025, contributing to copper strength in early 2026. Meanwhile, global oil supply is expected to grow faster than demand in 2026, with US production reaching around 13.8 million barrels per day (per BloombergNEF) and OPEC+ gradually unwinding cuts — which is why major bank forecasts (JPMorgan, Deutsche Bank, the EIA) sit broadly in the $55–65 range for Brent for the year, even as geopolitics keeps pulling spot prices higher.
Signal to watch: Inventory drawdowns. When refined copper at LME warehouses or crude at Cushing falls fast, supply is tightening before anyone announces it.
Driver 2: Demand
Demand sounds simple. It isn't. Real demand is a layer cake of consumption, substitution, expectations, and financial flows.
What moves demand:
- Macro growth — global GDP, especially China's industrial activity, drives base metals and energy.
- Structural demand shifts — the energy transition (copper, lithium, nickel), AI and data centres (copper, electricity, natural gas), biofuel mandates (palm oil, soybean oil, ethanol).
- Substitution — when copper gets too expensive relative to aluminium, manufacturers substitute. Sugar can substitute for HFCS. Palm oil substitutes for soybean oil and vice versa.
- Seasonal patterns — natural gas demand spikes in winter (heating) and summer (cooling). Gold demand spikes around Indian wedding season and Chinese New Year.
- Investment demand — ETF inflows into gold, financial positioning in oil, central bank gold buying.
Latest reality check: BloombergNEF projects US data centre power demand to reach around 48 gigawatts in 2026, pushing electricity grids toward reliability limits — and creating a demand pull for everything from natural gas to copper to nuclear-grade uranium. Central banks have continued buying gold, though purchases are expected to slow in tonnage terms as record prices constrain budgets. Chinese industrial demand has slowed sharply since Q3 2025, putting a ceiling on base metals despite supply tightness.
Signal to watch: The China demand pulse. Chinese factory PMI, copper imports, soybean crush margins, and steel rebar inventories are among the most useful early indicators of global commodity demand.
Driver 3: Geopolitics
Geopolitics is the wildcard that breaks every supply-demand model. A border closure, a sanctions package, a missile strike, an export ban — and a year of patient analysis becomes irrelevant overnight.
What moves geopolitics:
- Wars and military action — Russia-Ukraine reshaped European gas and global wheat. The Iran conflict reshaped Hormuz transit, LNG, fertilizer flows.
- Sanctions regimes — sanctions on Russian oil created a "shadow fleet" and a parallel pricing system for sanctioned crude.
- Resource nationalism — Indonesia's nickel export restrictions, China's tightening on rare earths and tungsten, Mexico's lithium nationalization.
- Trade wars and tariffs — US tariff threats in 2025–26 redirected metals flows, especially copper, into the US ahead of expected duties.
- Cartels and producer alliances — OPEC+ remains the single most important geopolitical commodity body on earth.
Latest reality check: Brent rose from around $72/barrel in late February 2026 to over $115 by the end of March, one of the sharpest monthly moves in recent memory, driven by geopolitical supply-disruption fears around Hormuz. Asian LNG benchmarks surged sharply over March; European gas prices followed. According to the World Bank's Commodity Markets Outlook, commodity prices are now projected to rise 16% in 2026 — the first annual increase since 2022 — with energy up around 24% and fertilizer around 31%, almost entirely on geopolitics.
Signal to watch: The "risk premium" embedded in front-month futures. When Brent trades $15–20 above bank consensus, the market is pricing fear, not fundamentals.
Driver 4: Weather
For agricultural and soft commodities, weather isn't a driver — it's the driver. For energy and metals, weather is a quieter but constant influence. Almost no commodity is weather-immune.
What moves weather impact:
- ENSO cycles (El Niño, La Niña) — these multi-year Pacific climate patterns redistribute rainfall and temperatures globally. El Niño tends to hurt Southeast Asian palm oil and Indian monsoon rain. La Niña does the opposite.
- Heat domes and cold snaps — Texas freezes shut in natural gas wells. European heat waves spike electricity prices and dry up French nuclear cooling water.
- Droughts — Brazilian drought devastates coffee and sugar. Panama Canal drought constrains global shipping.
- Hurricanes and cyclones — Gulf of Mexico hurricanes shut Louisiana refineries and offshore production.
- Frost — a single Brazilian frost in July 2021 took out 20% of the country's Arabica coffee crop.
Latest reality check: BloombergNEF and NOAA forecasts point to a developing El Niño event for 2026, with sea-surface temperatures running about +0.5°C above norms — already complicating natural gas demand expectations for the coming winter. Cocoa and coffee prices have eased from 2024–25 highs as weather improved in West Africa and Brazil — but inventories remain thin, and one bad season would tip prices back up sharply.
Signal to watch: The NOAA and ECMWF seasonal forecasts. Sophisticated agri desks read these the way oil traders read OPEC statements.
Driver 5: Freight and Logistics
A commodity that can't move is effectively stranded — and a stranded commodity loses most of its value. Freight rates, port congestion, canal availability, and tanker positioning are unsung heroes of price formation.
What moves freight:
- Vessel availability — VLCCs (Very Large Crude Carriers) and Suezmax tankers for crude oil; MR, LR1, and LR2 tankers for refined products; Capesize, Panamax, and Supramax for dry bulk like iron ore, coal, and grain. Each class has its own supply-demand balance.
- Choke points — Strait of Hormuz (a major share of global seaborne oil and a significant share of LNG flows), Suez Canal (~12% of global trade), Panama Canal (~5% of global trade), Bab el-Mandeb (Red Sea), Strait of Malacca.
- War-risk insurance — premiums for transiting Hormuz jumped during the Iran conflict, adding hundreds of thousands of dollars per voyage to the cost of a VLCC.
- Port and rail congestion — strikes at Argentine grain ports, US West Coast container backlogs, drought-induced Panama Canal slot limits.
- Bunker fuel costs — shipping fuel costs are tied directly to crude, so an oil rally adds to freight costs across every commodity.
Latest reality check: During the 2026 Hormuz disruption, refiners scrambled for non-Gulf crude — West African, Brazilian, US — which meant longer voyages, which sucked up tanker capacity, which sent VLCC day rates to multi-year highs. Tanker owners with empty ships in the right ocean made fortunes. Meanwhile, Panama Canal slot allocations remain a wildcard for grain and LNG flows from the US East and Gulf coasts to Asia.
Signal to watch: Baltic Dry Index (BDI) for bulk commodities, VLCC and Suezmax day rates for crude, and Drewry Container Index for finished goods. Freight is a leading indicator for everything downstream.
Driver 6: Policy
Policy is often slow to build — but when it changes, the market impact can be abrupt. A single tariff announcement, a single export ban, a single biofuel mandate can rewrite a market in hours.
What moves policy:
- Tariffs and import duties — US copper tariff threats in 2025–26 pulled physical copper into US warehouses ahead of duties. India's palm oil import duty changes shift Indonesian vs Malaysian flows in weeks.
- Export bans — Indonesia's periodic palm oil export halts, India's rice export restrictions, Argentina's beef export bans.
- Biofuel mandates — Indonesia's B40 biodiesel program, Brazil's ethanol blending, US Renewable Fuel Standard. These mandates directly route agricultural commodities into the energy market.
- Strategic reserves — China continuously builds and releases reserves of grain, oilseeds, and metals. The US SPR releases of 2022 took 180 million barrels out of strategic stock.
- Environmental regulation — the EU Deforestation Regulation (EUDR) affecting palm oil, cocoa, coffee, soy, rubber, and timber. Carbon border adjustment mechanisms. ESG disclosure rules.
- Monetary policy — Fed rate decisions move the US dollar, which moves all dollar-priced commodities, with gold being the most sensitive.
Latest reality check: US foreign policy has increasingly focused on securing energy market dominance, with pressure on Venezuela, Iran, and Nigeria. China, by contrast, continues to push hard on electrification and renewables. This US-China policy contrast is a major macro driver behind metals (copper, aluminium, nickel, lithium) and energy.
Signal to watch: Central bank meetings, OPEC+ decision dates, EU regulatory calendars, USDA reports. Policy events are the only commodity catalysts you can see coming on a calendar.
How the Six Drivers Talk to Each Other
The drivers are not independent. They form a feedback system:
- Geopolitics affects supply (Iran war shuts Hormuz, Russia sanctions redirect oil flows).
- Supply shocks affect freight (longer voyages spike tanker rates).
- Freight affects policy (Red Sea attacks pull insurance regulators and navies into the market).
- Policy affects demand (biofuel mandates redirect crops into fuel).
- Demand affects supply (high prices incentivize more production, eventually).
- Weather affects everything (cuts supply, redirects freight, triggers policy responses, shifts demand patterns).
This is why a single-factor analysis ("oil is up because Iran") is usually wrong. It's almost always two or three factors stacking simultaneously, which is what produces the violent moves.
The India Lens
For Indian commodity consumers, the six drivers translate into very specific exposures:
- Supply: India is a price-taker on crude, palm oil, pulses, and many fertilizers. Global supply shocks pass through quickly.
- Demand: India is one of the fastest-growing crude demand markets globally, the largest palm oil importer, and a structurally rising gold buyer.
- Geopolitics: Hormuz traffic, Russia-discount crude flows, China-India tensions affecting copper and APIs, US tariff regimes affecting steel and aluminium exports.
- Weather: The Indian monsoon is the single most important annual commodity event in the Indian economy. It affects pulses, sugar, edible oils, cotton, and rural demand for everything else.
- Freight: India's container and tanker freight from the Gulf and Southeast Asia is highly sensitive to Red Sea and Hormuz risk.
- Policy: Frequent changes in import duty (gold, palm oil, pulses), export restrictions (wheat, rice, sugar), and stockholding limits make Indian policy itself a major commodity driver.
Mini Case Study: The 2024 Cocoa Bull Market
Cocoa is the textbook example of multiple drivers stacking at once.
Supply: Ageing tree stocks in Côte d'Ivoire and Ghana (which produce over 60% of world cocoa). The swollen shoot virus spreading through plantations. Smallholder farmers, paid below cost, abandoning cocoa for illegal gold mining.
Demand: Stable global chocolate consumption, with steady growth from emerging markets.
Weather: Successive bad seasons — heavy rains, then drought — in West Africa. El Niño contributed.
Freight: Inventories at major consumer ports drawn to multi-decade lows, with new shipments scarce.
Policy: Côte d'Ivoire's and Ghana's farmgate price floors prevented producers from capturing the upside, weakening replanting investment further.
Geopolitics: Producer-country leverage — Côte d'Ivoire and Ghana attempted to coordinate a "Living Income Differential" premium with chocolate buyers, a producer-cartel approach modelled loosely on OPEC for cocoa, adding price uncertainty for processors.
Multiple drivers lined up. Cocoa hit historic highs above $12,000 per ton in late 2024 — nearly tripling in eighteen months. Hershey, Mondelez, Lindt, and Mars saw historic margin compression. Indian and European chocolate brands raised prices. Some smaller manufacturers exited entirely. Prices have since corrected as weather improved and 2025–26 harvests came in better, but the structural issues remain.
Anyone watching only one driver — say, just weather — missed the size of the move. The lesson: commodity intelligence is multi-factor or it isn't intelligence.
The Operator's Mindset
Headline readers ask: "Why is oil up?"
Operators ask six questions in parallel:
- What is happening on the supply side that the market may not have fully priced?
- Is demand actually changing or is this positioning?
- What geopolitical events are baked in and what isn't?
- What does weather data tell me about the next 90 days?
- What are freight rates and choke points doing?
- What policy actions are calendared in the next 30, 60, 90 days?
This is the operator's mindset. It is not glamorous. It is checklist-based, repetitive, and disciplined. And it is the difference between buying input cost certainty for your business — and being whipsawed by every headline.